


When Will Japan's National Debt Become a Problem?
Not for a while, but long term pressures are building

A look at the headlines concerning Japan’s national debt reveals doom-laden terms like “time bomb”, “mountain” and “bankrupt”. This article from Reuters, being just one example.
It’s not the stock, it’s the flow
But thinking about national debt as a simple debt divided by GDP metric may be the wrong way to go according to Jason Furman, a professor of economic policy at Harvard Kennedy School and Harvard University. Japan’s debt by this metric does look alarming at 264 percent of GDP. Imagine if you owed more than twice your annual income in debt. In fact, you probably do if you own a house, but then there’s an asset of similar value to offset that debt.
There are three problems with this metric, according to Furman. The first is that you are dividing a backward-looking stock (all the debt you’ve currently built up) by a flow (your annual income). Part of his answer to this is to change the flow part of the equation to a stock. Instead of dividing the debt by one year’s GDP, he divides it by the net present value of GDP with an infinite horizon. There’s a handy explainer and calculator for net present value here. How do you calculate something with an infinite horizon? I’ve no idea, but you probably end up with a huge number as a denominator, which shrinks the debt to GDP ratio down to something like 0.5 percent. This sounds much more manageable.
The second problem with the debt/GDP metric is that it does not reflect interest rates. What we really want to look at is the net interest payments each year:
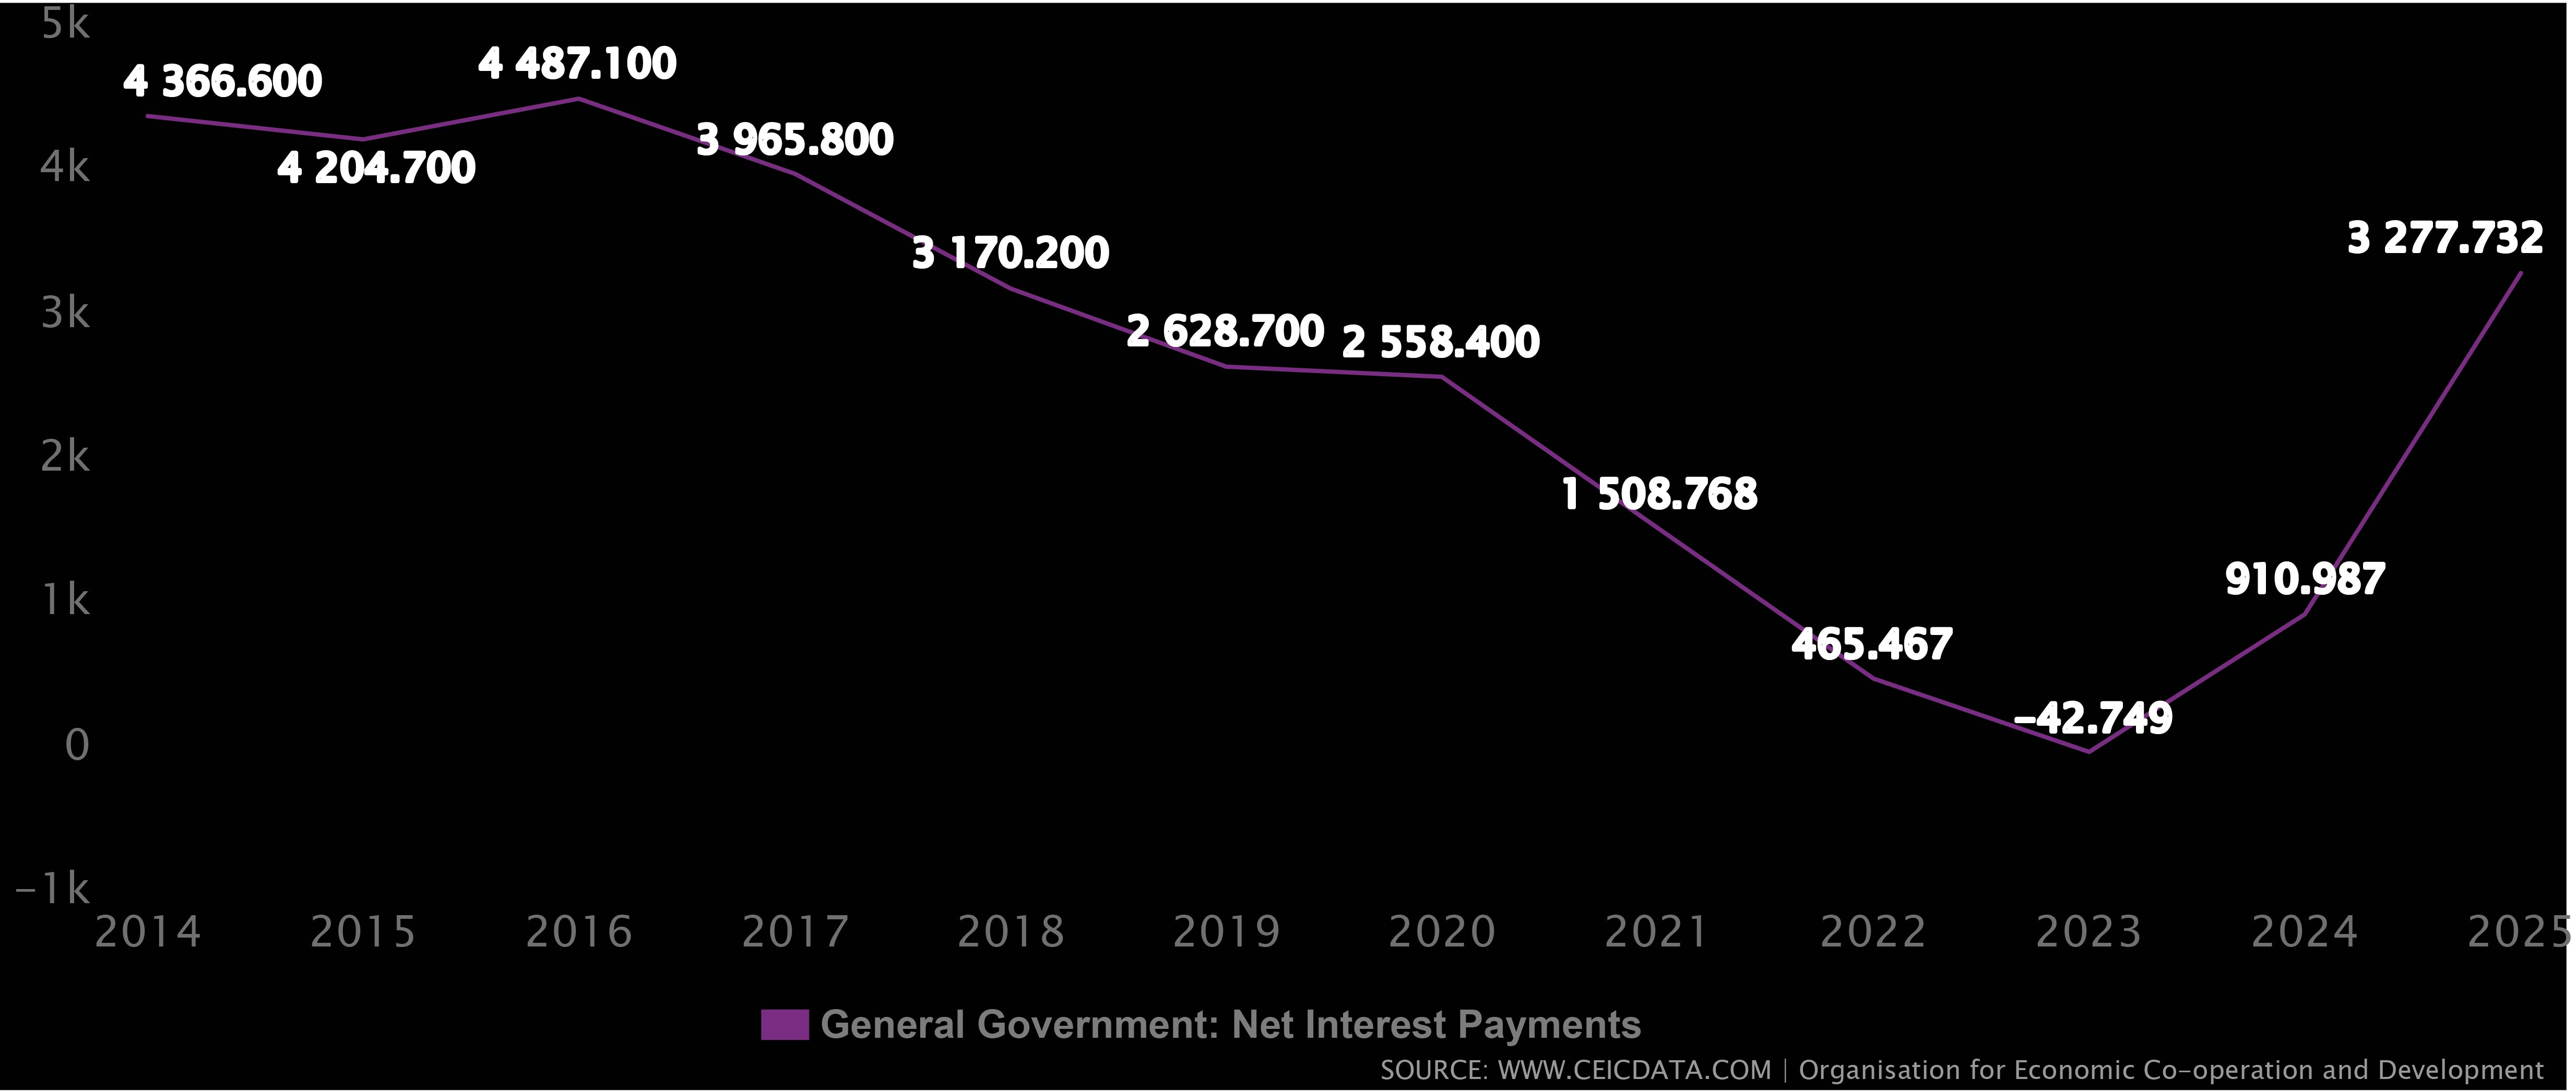
Which have actually been falling since 2014 and even turned negative in 2023. A sharp rise is forecast for 2025, but this is still below the level they were at as recently as 2017. If you want to understand the current cool-headedness about the Japanese debt, this is probably the reason.
Now let’s compare these interest payments with the size of the economy. We’re comparing a flow (annual interest payments) with another flow (annual GDP). The interest paid on public debt as a percent of GDP was 1.42 for Japan in 2022. This compares with 2.86 percent in the US and 3.97 percent in the UK (just after Liz Truss’s disasterous mini budget).
Is growth faster than real interest rates?
That’s the situation now, but what will happen in the future? The important thing is that growth exceeds real interest rates (nominal interest rates minus the rate of inflation):

Real interest rates have been slightly negative or zero for the last few years. With the recent rise in inflation, real interest rates are likely to remain slightly negative for the foreseeable future. With GDP growth at around one percent a year and real interest rates at minus one percent a year, this leaves a two percent gap. With growth exceeding real interest rates like this, the Japanese government can run a primary deficit of around 4 percent of GDP. (thanks perplexity.ai for the calculations!)
So, how is Japan’s primary balance1 currently? Since the Asian financial crisis of 1997/1998, it’s been running at about minus 5 percent of GDP. For the next few years, it’s forecasted to be about minus 3 percent of GDP. (source: IMF). So again, for the foreseeable future, everything seems OK.
Is it even possible for a government to default on its local currency debt?
Yes, it’s rare, but it does happen. Governments can just print money to cover their debt payments, or they can get the central bank to hoover up bonds as the Japanese central bank has done over the last few years. The problem with the first is that it tends to lead to high inflation, the problem with the second is that it will lead to artificially low interest rates, weakening the currency and ultimately to inflation. In this paper, the authors point out that defaulting on local currency debt does happen, but often due to reasons other than the size of the local currency debt. Local currency defaults often occur as governments try “to curtail black markets”.
The black ships are coming back…
Now, let’s measure a stock against a stock. To keep buying domestic debt, there needs to be a pile of domestic savings available to cover it. Currently household savings available for buying government bonds are about 1660 trillion yen2 and the current total net government debt is around 937 trillion yen3. With some corporate savings thrown in, there’s currently enough savings to buy the debt nearly twice over.
So, no problem, right? Not so fast. With a household savings rate currently around the zero mark, the pile of savings is unlikely to increase. At the same time, with negative interest rates, domestic savers are more likely to invest in stocks rather than anything that directly or indirectly invests in government bonds. The recent popularity of NISA products that invest in domestic and overseas stock markets reflect this. The Bank of Japan is also reducing its purchases of government bonds, and who does the Ministry of Finance want to step in to replace it? Foreign investors, who are likely to demand a higher interest rate.4 Currently, foreign investors make up 13.5 percent of the holders of JGBs (Japanese Government Bonds). This has risen from 9.2 percent in 2014.5
While the amount of domestic savings available to cover the domestic debt is unlikely to increase, the amount of government debt is likely to keep rising. Japan seems unable to keep its deficit below 6 percent of GDP in the long run, see this chart below from Richard Katz’s Substack:

Between 2013 and 2023, Japan’s net government debt rose from 130 percent of GDP to 158.5 percent of GDP. If this trend continues, we end up with the situation below:

By the mid to late 2040s, the amount of domestic savings no longer covers the debt, and either the BOJ will be back to buying bonds, or foreign investors will have to buy all the new debt. At this point, real interest rates will surely be higher than the growth rate, and this will be the crisis point for Japan.
So, relax, we’ve got about twenty years yet.
The primary balance is government revenue minus government expenditure not including interest payments.
https://www.statista.com/statistics/1237816/japan-quarterly-household-financial-assets-by-type/
158.5% of GDP of 591.4 trillion yen
Japan taps brokerages to market JGBs abroad as BOJ steps back - Nikkei Asia
https://www.statista.com/statistics/1169938/japan-ratio-of-japanese-government-bonds-held-by-foreign-investors/
You just gave me a headache.
While this was a bit technical for me, it is somewhat reassuring -- at least for the next 20 years.
In your estimates of government spending in the future, did you allow for a steady increase (e.g., to cover the ongoing costs of caring for all the elderly and beefing up the defense budget to counter China and North Korea)? If so, have you accounted for any dramatic increases, e.g., as part of a sensitivity analysis? How do such contingencies affect your long-term outlook?